
Category Archives: Project
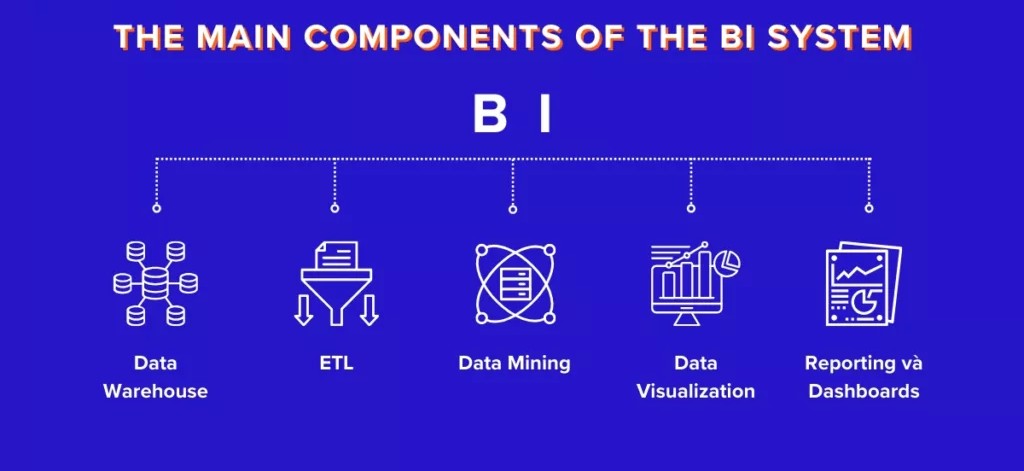
Business Intelligence
During the final phase of my university studies, I found myself facing numerous job opportunities, several companies reached out to me to manage websites, develop various applications, or work as a system administrator, however, none of these proposals truly aligned with my interests and professional aspirations. I felt that something was missing a spark that would make my work stimulating and meaningful.It was then that, through personal research, I discovered a field that immediately captured my attention: Business Intelligence (BI). This technical discipline fascinated me from the start because it wasn’t just about writing code or managing IT infrastructures, it was about something bigger giving value to data by transforming it into strategic and useful information for businesses. Business Intelligence is a field that allows for the collection, processing, analysis, and visualization of data to support business decisions, through specialized tools and advanced techniques, it is possible to extract valuable insights, optimize processes, and improve corporate efficiency. In other words, BI is not just about technology it bridges the gap between technical expertise and strategic decision making.Entering this field was a turning point for me, it allowed me to combine my passion for technology with my desire to make a tangible impact on how businesses operate and make decisions. Today, working with data and analytics, I truly feel like a part of a transformation process that helps people work better and more efficiently. At the beginning of my journey in BI, I had to make an important decision: should I start with Qlik or Power BI to gain experience and learn the trade? After careful consideration, I decided to dive into Microsoft’s Power BI suite, I underwent about six months of training, working alongside experienced professionals while handling projects for various clients.After gaining initial hands-on experience, I was assigned to more complex projects, collaborating with well-known companies such as Cattolica and Caritas for a few more months. Then came a major turning point Reply, a renowned consulting firm, brought me on board and placed me in a large scale project within the OVS Group. This has been my most significant professional challenge so far, and I am still part of this incredible journey today. At OVS, my initial project was to migrate all reports, analyses, and data extractions from SAP BO to the Microsoft suite, for an entire year, I worked tirelessly to recreate, modify, and refine these reports while granting users access within Power BI. This process required me to adapt to the company’s structure and comply with administrative constraints, in total, I migrated around 120 reports of various types. The following year, as Power BI became widely used at both operational (store level) and executive (board level) levels, I was given greater responsibilities. I developed an automated update structure using Azure and Power Automate, implemented role based row-level security via REST APIs, and set up monitoring for error detection in data flow updates.Throughout this period, I continued migrating legacy analyses to Power BI while creating new ones based on department requests. Over the past year, after establishing a solid reporting structure with approximately 250 accessible reports, I began focusing on e-commerce analytics. To streamline my work, I built a small data warehouse, which introduced me to functional analysis, three-tiered data structuring (bronze, silver, and gold), endpoint mapping, invoice management through dummy lines, and more leveraging Microsoft Fabric to facilitate these operations.One of the more complex and rare tasks I handled during this period was the migration of region and capacity settings, initially, Power BI was used by only around 500 employees; today, that number has grown to 3,000. I was also entrusted with the supervision of all activities within the platform, ensuring its proper use and maintaining administrative rights. The Current Landscape As of now, the system I manage consists of: 21 Power BI Apps 60 Workspaces 400 Reports 200 Datasets 3,000 Users, with 2,000 actively using the platform Row-level security applied across all reports Approximately 90% of the components have been designed, developed, and published by me, while the remaining 10% were created by external contributors for projects predating my tenure or for analyses requested by the non-Italian OVS IT division. My journey in Business Intelligence has been both challenging and rewarding. Through continuous learning and problem-solving, I have built a robust and scalable analytics environment that supports decision-making at all levels of the company. Looking ahead, I am eager to further refine these systems, explore new BI technologies, and continue driving data-driven transformation at OVS.
Oculus
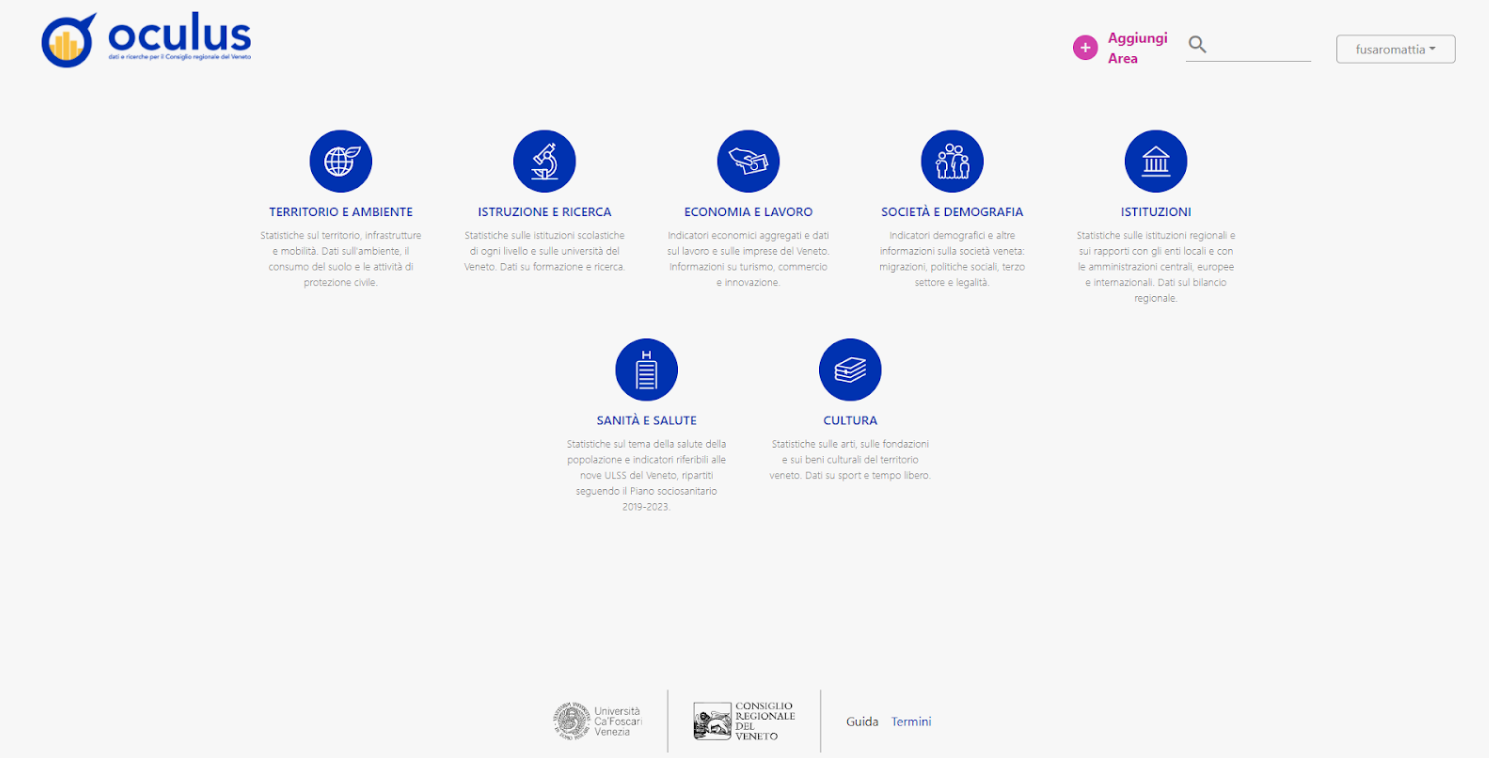
For the completion of my bachelor’s degree at Ca’ Foscari, as in any university, it was necessary to either carry out a personal project or complete an internship at a partner company. In my case, I was contacted by a professor who needed a few students for a 3 to 6 month project involving the update and optimization of an internal website used by the Veneto Region. The project was quite clear: we had to revive an old, rarely used website that had been neglected and make it accessible, modern, and functional for regional council members. These council members required a unified tool that would allow them to analyze all regional data from any location whether at home, at the office, or on the go, this included information on tourism trends, active research within the region, employment data, funding and incentives, population census statistics, and more. Oculus was created about seven years ago to meet the needs of the council as a project developed by the Faculty of Economics at Ca’ Foscari, it is a full-stack web application, divided into two main components: A front-end web application designed as a Single Page Application (SPA), implemented in TypeScript using the Angular framework. A back-end web service with a RESTful API, implemented in JavaScript on a Node.js environment. The platform allows users to upload data in CSV format and visualize it through various types of charts, with filtering options to enable deeper data analysis. Data is categorized based on the type of event or environment they describe, following a structure similar to government ministries such as environment, labor, health, education, and so on. Each category is further divided into sections, representing the specific events or studies to be analyzed, within these sections, users can fully and securely manage the data viewing, deleting, modifying, and downloading it as needed. So, before and during the summer of 2021, along with two colleagues, I worked on updating, refining, and adding new features to the product. Fortunately, the initial phase was less complex than expected, we mainly had to identify the library versions that would best support our development process, however, the next phase turned out to be much more challenging. We were asked to address some issues with the application and implement new features, since it was a long-term project, we divided the work into smaller tasks and set milestones to stay on track. Specifically, I was responsible for: Developing a tool for data editing, including an algorithm to enrich specific CSV files. Exploring potential evolutionary paths for the application to enable (semi)automated data updates. Fixing various CSV upload bugs, such as data loss, incorrect formatting, upload failures, and out-of-scale values. Adjusting and generating the CSV format for downloads from the platform. Looking back, I can say that this experience was truly rewarding, not only did I get the chance to work on a real world project that had a tangible impact, but I also had the opportunity to meet many people fellow developers, professionals in the field, and even some regional council members. Working closely with them allowed me to better understand their needs and how technology can provide concrete solutions to complex problems, it was incredibly satisfying to see how our work contributed to making data more accessible and usable for decision makers. Beyond the technical skills I developed, this experience also opened up new opportunities for me, it helped me gain visibility in the field, connect with industry professionals, and even led to potential job offers and collaborations in similar areas, it reinforced my interest in developing tools that can improve data analysis and accessibility, and it gave me the confidence to take on future challenges in this space. Overall, it was a journey that combined learning, teamwork, and professional growth one that I am truly grateful for. Of course, I then had to write my thesis to complete my studies, however, that process ultimately led me down a different professional path, but that’s another story.
Cartography Venice Project Center
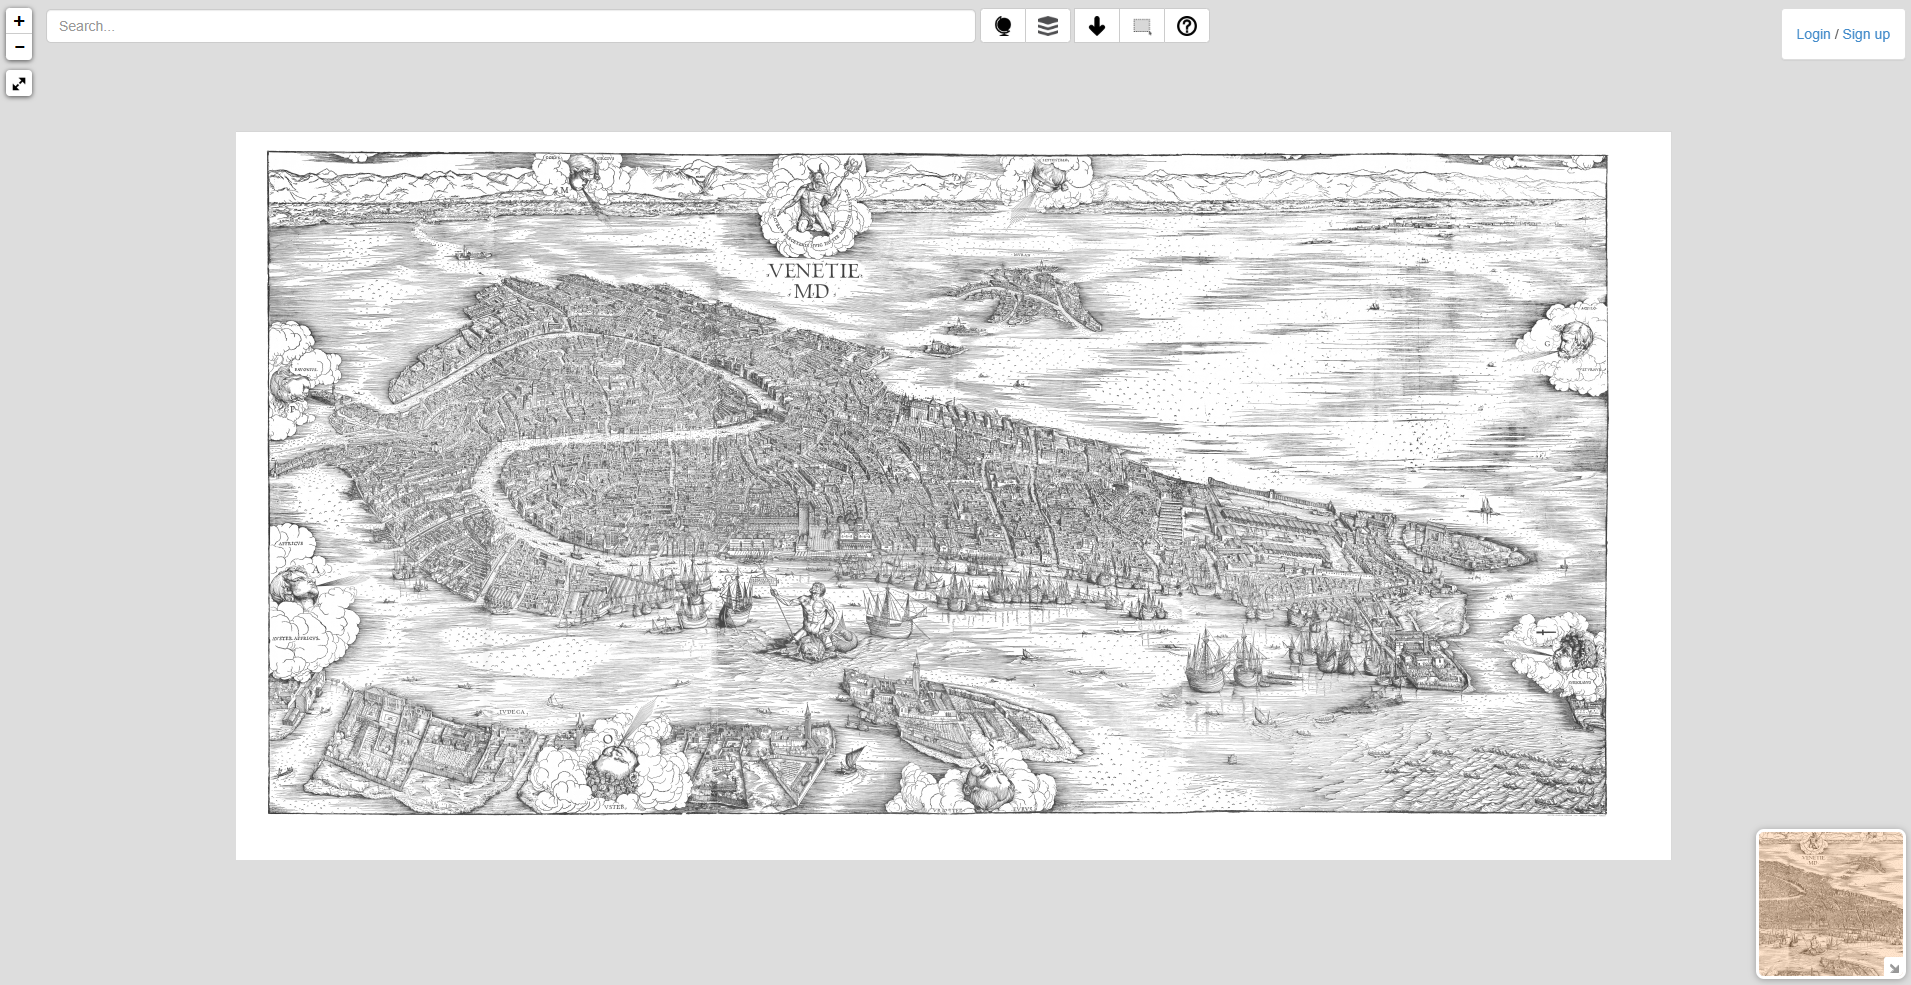
During high school, the Italian government required IT students to complete an internship of 400 to 600 hours, at the time, I didn’t realize that the conditions might not be ethical or equitable, but I was incredibly excited. Finally, I had the chance to work in an office alongside real programmers, gaining firsthand experience in the field I was passionate about. So, one foggy day in November, a small web development office called me and offered me a long internship, and that’s how it began, just a young version of me, full of dreams and eager to learn, stepping into a world full of new experiences and endless possibilities. I was fascinated by the location of that office, right in the heart of Venice, near the famous bridge (I swear, it’s not my fault!) called Ponte de le Tette, it was such a unique and captivating spot, adding a bit of charm to the experience of working in one of the most beautiful cities in the world. Speaking about the job I did in that office, it wasn’t easy, they took a tough approach. During the first year, which amounted to about 150 hours, I mainly focused on debugging and solving small issues in the code, it was a lot of repetitive work, but it laid the foundation for understanding the intricacies of programming and problem-solving. After that, they acknowledged that I wasn’t a complete newbie anymore, the task became more challenging: I was assigned to take an old, unused website, fix its issues, create new features, and add fresh content, it was a significant step up, pushing me to apply what I had learned and develop new skills while breathing new life into an outdated site. The site was an interactive map showcasing all historical maps of Venice, from Jacopo de Barbari to Ludovico Ughi. However, it was buggy, extremely slow, and far from user-friendly, together with a small team, we worked for about 200-300 hours to revamp it, we focused on improving the performance, fixing bugs, and making the user experience smoother, transforming it into a more functional and engaging tool for visitors. Jacopo de’ Barbari 1500 Matthäus Merian 1635 Ludovico Ughi 1729 Bernardo & Gaetano Combatti 1847 Each map could be expanded to a minimum level of detail, and through a recognition system, many points on the map were identified with their names. The most intriguing part of the project was highlighting the transformations across these maps, showing how landmarks like bridges or churches were either removed or reconstructed over time. This allowed users to visually track the changes in Venice’s landscape through different historical periods, adding depth and context to the maps. The work was highly appreciated and even used by several offices in Venice. Eventually, journalists came to speak with us about the project, on the right is the only screenshot I have of it, capturing a moment of pride for all the hard work and collaboration that went into bringing this historical map project to life. There’s certainly a lot to reflect on regarding the points raised in this article, but now is not the time. After that project, during my last 100-200 hours, I was introduced to Angular and other new technologies. It was an exciting experience, I even attended meetings with some of the brightest minds in web development from other companies, learning a great deal along the way, however, I had to leave the internship behind to begin my university studies, marking the end of that chapter and the start of a new journey.